 Loading... Please wait...
-
Call us at 978-392-1461
- Gift Certificates
- My Account

- Home
- Classroom Posters
- Explore Community Data Bar Graph Pie Chart Educational 12x18 US Made Poster
Categories
Related Products

Explore Community Data Bar Graph Pie Chart Educational 12x18 US Made Poster

Hover over image to zoom
)
Product Description
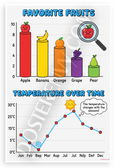
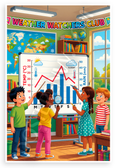
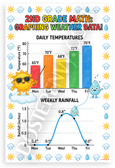
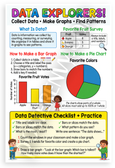
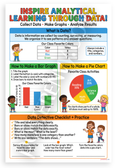
This 12x18 inch poster is printed on premium, durable paper. Proudly Made in the USA by PosterEnvy. The perfect size for any room. PosterEnvy is a family owned business, delivering top-notch posters around the world for over 20 years. Our posters are designed to last — they won't fade or pucker for years of enjoyment. Every poster features crisp, vivid artwork. We are a solar powered company. This vibrant cartoon-style educational poster teaches second graders how to read bar graphs and pie charts using real community data on population decline and time use. Includes data detective checklist and analysis questions with diverse kids pointing at graphs.
- Premium Print: This PosterEnvy 12x18 inch poster is printed on Durable, Heavy Duty Paper, Designed to last many years. Features bar graph of population change and pie chart of community time use with analysis questions
- Proudly Made in the USA: PosterEnvy is a Family owned business, delivering top-notch posters around the world for over 20 years. Ideal for elementary math social studies classrooms data graphs community information
- Solar Powered Production: All our posters are designed and printed using solar energy, with crisp vivid artwork. Bright primary colors cartoon style bar graphs pie charts educational kids learning
- Engaging Data Graphs: Vibrant bar graph shows population decline over 4 years pie chart displays community sports art activities time use. Perfect for classroom walls homeschool study areas sparking math discussions
- Perfect Gift Idea: Great for teachers parents homeschoolers second grade educators. Ideal back to school teacher appreciation birthdays supports data analysis graphing skills community studies
Find Similar Products by Category
Product Reviews
You Recently Viewed...
Quick Links
What's News
Follow us on

Copyright 2026 PosterEnvy.com. All Rights Reserved.
Sitemap |
BigCommerce Premium Themes by PSDCenter